GIST *Helps you prepare & present research reports & proposals |
|
|
|
GIST Home |
Evolution of GIST |
The Problem: Many scientists are unclear about how to structure their reports and proposals, with the result that these become difficult to write and, eventually, to understand.
One Reason: The typical process of preparation (i.e. writing a series of drafts) requires the scientist to be simultaneously working at too many levels of text structure (e.g. overall flow, paragraph construction, grammar).
A Solution: Start the preparation process by using diagrammatic approaches that shift the focus onto issues of thought organisation, rather than language.
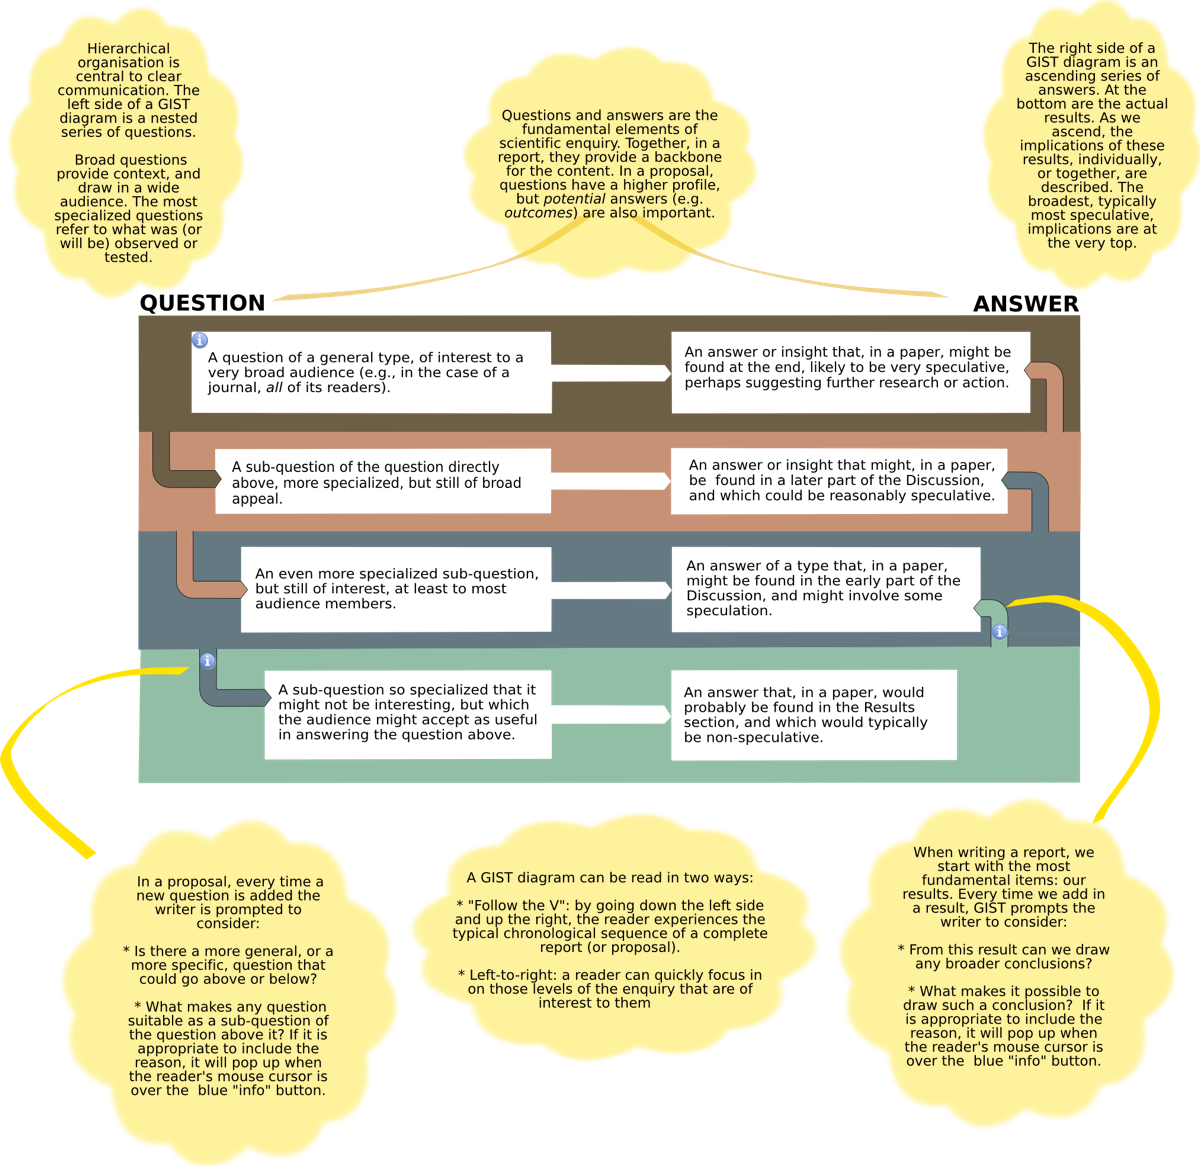
GIST will be open-source software that provides three diagramatic approaches to help a scientist to prepare and present a research report or proposal. The most conceptually important of these approaches will encourage the scientist to organise the report or proposal based on a mirrored set of nested questions and answers - or potential answers in the case of a proposal. I will refer to the output of this stage as a GIST diagram (see example below). A GIST diagram is expected to be both useful in itself (a new type of Abstract?), and as an intermediate framework for further elaboration. Also, beyond being an aid to writing, using a GIST diagram, and the other components of GIST, should help scientists to appreciate the deep structure of a scientific report, and scientific enquiries in general.
Report Writing using GIST in 3 Steps
Diagram Approach 1
This approach is similar to traditional argument mapping but with one very important difference: an argument map is initiated by adding in a claim at the top, after which reasons and objections are added below. But this is the reverse of how reports are usually developed. For example, in a student-supervisor collaboration the first step of paper writing will typically involve sitting down with all the results and then deciding (1) whether they are believable and (2) if so, what implications they might have. Of course, the investigation may well have set out to test an hypothesis, perhaps with the hope of a particular outcome. In my experience, however, at the end of the data-collecting phase most investigators try to set aside any such hopes, and focus on what the results actually show. The GIST system would try to encourage this approach, although it would not enforce it.
A. Results are noted:
![]()
Each of these boxes would contain a single sentence summarising one result.
B. Direct implications of the results are added in:
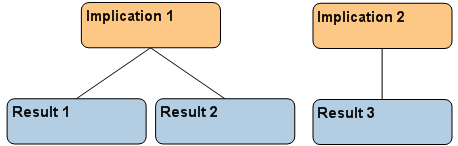
C. Indirect implications are added in:
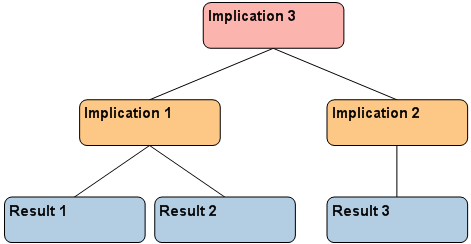
In making a map like this, one is actually constructing an hierarchical map for the entire Discussion section. At the bottom levels, the map is truly an argument map, perhaps looking at the evidence in favour of a particular hypothesis. At the higher levels, however, the map depends more on non-argumentative aspects. For example, a higher level box may contain a sentence that briefly mentions all of implications for management, or future research etc. Thus different organising principles apply in different parts of the map.
Having completed the "reverse" argment map, this is then exported to a GIST diagram, where it generates the "Answer" side of a diagram. The map and the "Answer" side of the diagram have of course an identical logical structure, but the map approach is much more intuitive to work with during construction. Also, an expanded version of this map (in which evidence from other studies is included) could be a valuable collaborative tool in its own right. "Non-core" elements would be given some attribute to ensure they were not exported into the GIST diagram.
Diagram Approach 2
At this point we have half of a GIST diagram, "Answers" only. The next step is to allow the software to mirror the right side, creating one blank question box for each answer. The writer then fills in each empty box with an appropriate question. This is not necessarily easy, especially since the diagram needs to read smoothly in two directions (1) "Following the V" : down the left-side and up the right (as per the chronological sequence of a paper) and (2) horizontally.
The GIST approach does not promise to make paper writing easy, but it will hopefully make it easier.
Diagram Approach 3
Before proceeding to the final diagram, one must categorize the questions (and by extension, the "answers"). Questions in papers generally fall into two categories:
* More general questions that will be considered of interest by your average target-audience member.
* Specialized questions that, while not of interest in themselves, will be accepted as being necessary as a means to the end of answering a question of the first category. Such questions often involve shifting away from the "real world": we use a sample of a population, or a mathematical model of it. In other cases, a very specific prediction of one answer to a general question is tested. These specialized questions can be considered as proxies for the general questions.
Once you have categorised the questions (and thus the answers), all the questions and answers will then fly off" to the "right places" on a word-processing template of a scientific paper. This template (not shown here yet) will have the basic IMRAD format but will also draw upon an advanced understanding of where dfferent types of questions and answers are found within the Introduction, Results and Discussion. The "advanced" understanding draws upon previous research into report structure, and my own analysis of paper structure as outlined in my online writing course (e.g. see discussion of the structure of the Introduction here). As one example, answers to the specialized questions might generate sub-headings in the Results section, whereas answers to general questions would be likely to generate sub-headings in the early or late parts of the Discussion.
With the various questions and answers in the right locations in the template, the writer then proceeds to flesh out the text.
Proposal writing using GIST
Proposal writing would only involve at most two diagrammatic approaches.
Diagram Approach 1
Summarize the enquiry using a GIST diagram of the type shown above. "Answers" could include:
Diagram Approach 2
As for a report, categorize the questions (and if appropriate, the "answers") according to the scheme used by the granting agency. Each agency has its own terminology to refer to questions at different hierarchical levels, and there is no consistency from one agency to another. Possibilities include: Aim, Goal, Objective, Issue, Purpose.
The questions thus categorized would now "fly off" to the "right places" on a second diagram, which would be a template specifically based on the actual proposal for the granting agency being approached. GIST would supply a master template for proposals, and agency-specific versions would be generated by the user. This may be too difficult to implement, both in design and end-use, so this would be an optional part of the system.
If you have any Questions or Comments please leave a comment in the guestbook, using the link below, or email Geoff Hyde at the National Centre For Biological Science, Bangalore: geoffATncbsDOTresDOTin
See a paper  summarised with GIST
 Leave a comment