The Science Of Scientific Writing Set E Generic Sections Maps as Section Blueprints Exercise 1 Exercise 2 ImRaD Methods : Structure Methods: Coherence Exercise 3 Final Page .
OVERVIEW: The way to well-written science
PART I: Paragraphs and Sentences
SET A: Paragraphs: The Maps Behind Them
SET B: Paragraphs: Using Maps to Meet Readers' Expectations
SET C: Paragraph Coherence and Cohesion
SET D: Sentences
SET E: Scientific Sections (including Methods)
SET F: Scientific Sections: The Discussion
SET G : Scientific Sections: The Introduction
SET H : The Paper as a Whole
Materials and Methods (2): Coherence
The two strategies we will consider for increasing the coherence of the methods section are these
- having one dominant (core) purpose (report) which is not overwhlemed by any non-core content
- having paragraphs with Framing or Point Sentences, which, considered together, tell a coherent story
The Methods should have a single purpose
Your first priority in the Methods section is to report what you did, and few writers have trouble making this the dominant theme of the section of a whole. Indeed more of a problem is not including anything else. In particular, as noted on the previous page, you shoud be introducing some non-core content of an explanatory type, that gives the reader some insight into why you did what you did.
When writing in Report mode you must always write in the past tense, because you are describing what you did. In the non-core parts of the Methods, for example when you are explaining something, you may occasionally need to change to present tense. In the paragraph below, from this paper, the verbs in italics are in past tense, while those in bold are in present (or subjunctive) tense:
The 522-nm filter of the K2 block selected the Ca2+-sensitive Fluo emissions (F) and the 607-nm filter selected the isobestic emissions of SNARF (S). It is important to understand that at this wavelength, the SNARF emissions are independent of variations in both Ca2+ and H+ concentrations; thus variations in the ratio between the intensities of the two dyes should indicate variations in Ca2+ concentrations, assuming that there are no variations in concentrations of the two dyes. Ratio images (F/S) were created on an Image-1 system (Universal Imaging Corp., West Chester, PA). Some images were acquired using the standard photomultiplier mode of the confocal microscope, but no quantitative measurements were made from these.
A map can act as a flowchart that will help you organise the Methods
The main way that readers use the Methods section is this: they are reading the Results, they come across a result for which they want to know more about the methodology, a nd then they scan the Methods section hoping to to find the relevant information. You have to do everything you can to make such searches quick and accurate. This can be quite a challenge in many areas of science, because the experimental approaches can be quite complex. It has been a common experience on my part that when I go to the Methods section, and start tracking the sequence of actions, I often get to a point where what happnes next is ambiguous. Two possibilities could spring to a reader's mind in this situation:
- The authors have forgotten to include the necessary details that would clarify the ambiguity
- The experimental approach itself lacked the necessary steps that would exclude the ambiguity
Obviously, either thought can make a bad impression on the reader, but if the second one dominates, it could potentially lead a reader to dismiss the paper altogether.
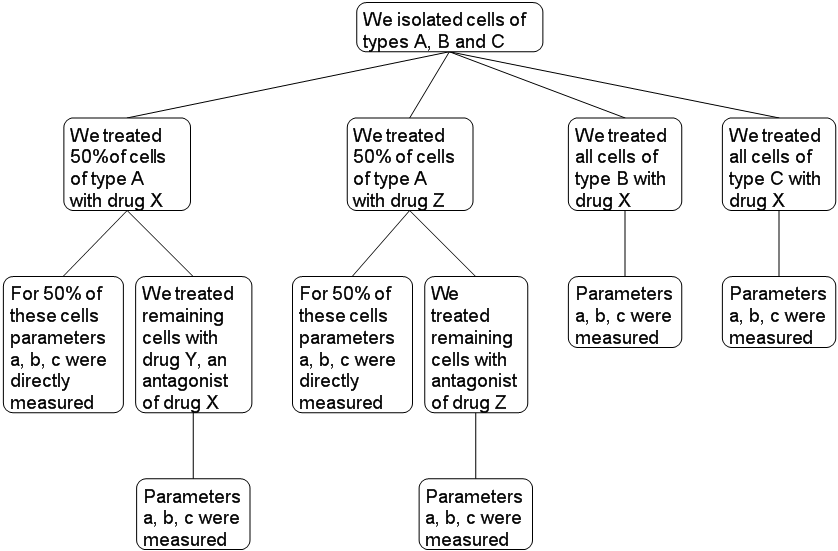
As a writer and scientist, you can reduce the likelihood of both of these situations by using a map to draw up a flowchart of your entire methodology, or of parts of it. For example, the map below details a reasonably complex (fictional) series of drug tests.
A map as a schema for writing up the Methods
Just as we did for planning a generic section, we can also use a map to organise the sub-sections and paragraphs of the Methods. Note that when writing, a flowchart that is adequate for understanding the logic of an experiment may not necessarily work as a writing plan. For example if we used the flowchart above, we would generate text with considerable repetition because there is considerable overlap in the use of the methods. We need to think of a schem/flowchart that groups the common elements, e.g.
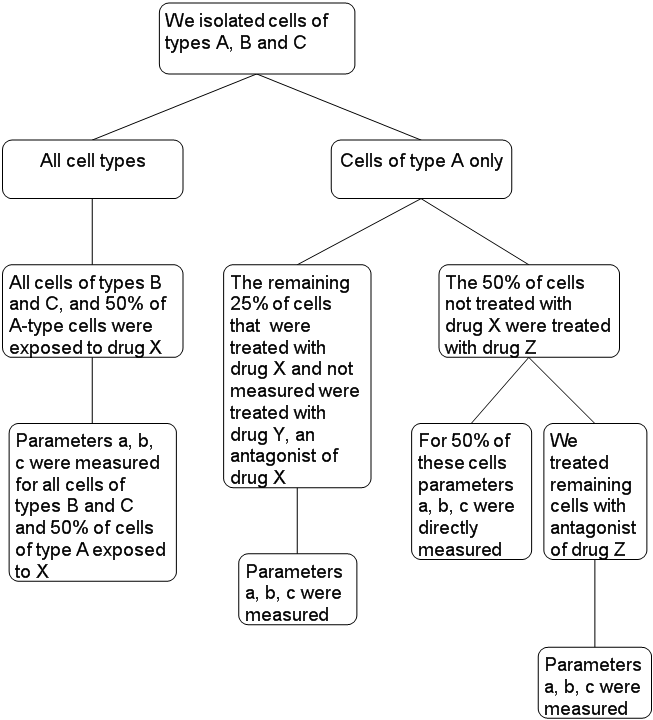
We can demonstrate that a more efficient grouping has occurred by comparing the number of connecting lines in the upper and lower maps: it has been reduced from 12 to 10.
This might generate a sub-section, with its own two sub-sections, like below:
Isolation of cells and treatment with drugs
Cells of types A, B and C were isolated from the tissue.
All cell types: All cells of of types B and C, and 50% of the A-type cells were exposed to drug X, after which parameters a, b and c were measured in all cells of types B and C, and in half of A-type cells exposed to X.
Cells of Type A only: The cells that had been exposed to X (see above) but not measured directly were treated with drug Y, an antagonist of X, after which parameters a, b and c were measured. All of the A-type cells not treated with X, were treated with drug Z. For half of these cells, parameters a, b and c were measured directly. The remaining Z-treated cells of type A were further treated with an antagonist of Z, after which parameters a, b and c were measured.
Organising Principles within the Methods
Earlier we discussed how the the content of a paragraph (and now by extrapolation a section) can be organised according to one or more Organising principles. The primary Organising Principle in a scientific paper is always one of the four three modes of discourse ( Description/Report, Argument, Explanation). There are a range of other organising principles that can be used for secondary or tertiary sorting of content (see this page). The primary mode of the Methods is of course Report. The two most common secondary principles include:
1. Chronological order
2. Experimental logic: this often overlaps strongly with Chronological order. For example we must often first choose a study site, or an organism, before we can proceed to study it in more detail. These two principles also overlap, but not fully, in the drug-treatment example provided earlier on this page
Individual Characteristics of the Methods Section
Note these features particular to working with and writing up a map for the Methods:
- Sub-headings and sub-sub-headings play a bigger part in the map and the text than in other sections. A sub-heading placed between two paragraphs alerts the reader to the possibility that the "story" of the section may now start to head in a different direction.
- Sub-headings are often phrases rather than sentences.
- The sentences in the map often become sentence parts, and the sentences they join may have many parts.
![]()
![]()
......