The Science Of Scientific Writing Set F The Discussion: Answers Two Main Parts Maps for Discussions Exercise 1 Final Page .
OVERVIEW: The way to well-written science
PART I: Paragraphs and Sentences
SET A: Paragraphs: The Maps Behind Them
SET B: Paragraphs: Using Maps to Meet Readers' Expectations
SET C: Paragraph Coherence and Cohesion
SET D: Sentences
SET E: Scientific Sections (including Methods)
SET F: Scientific Sections: The Discussion
SET G : Scientific Sections: The Introduction
SET H : The Paper as a Whole
Exercise 1
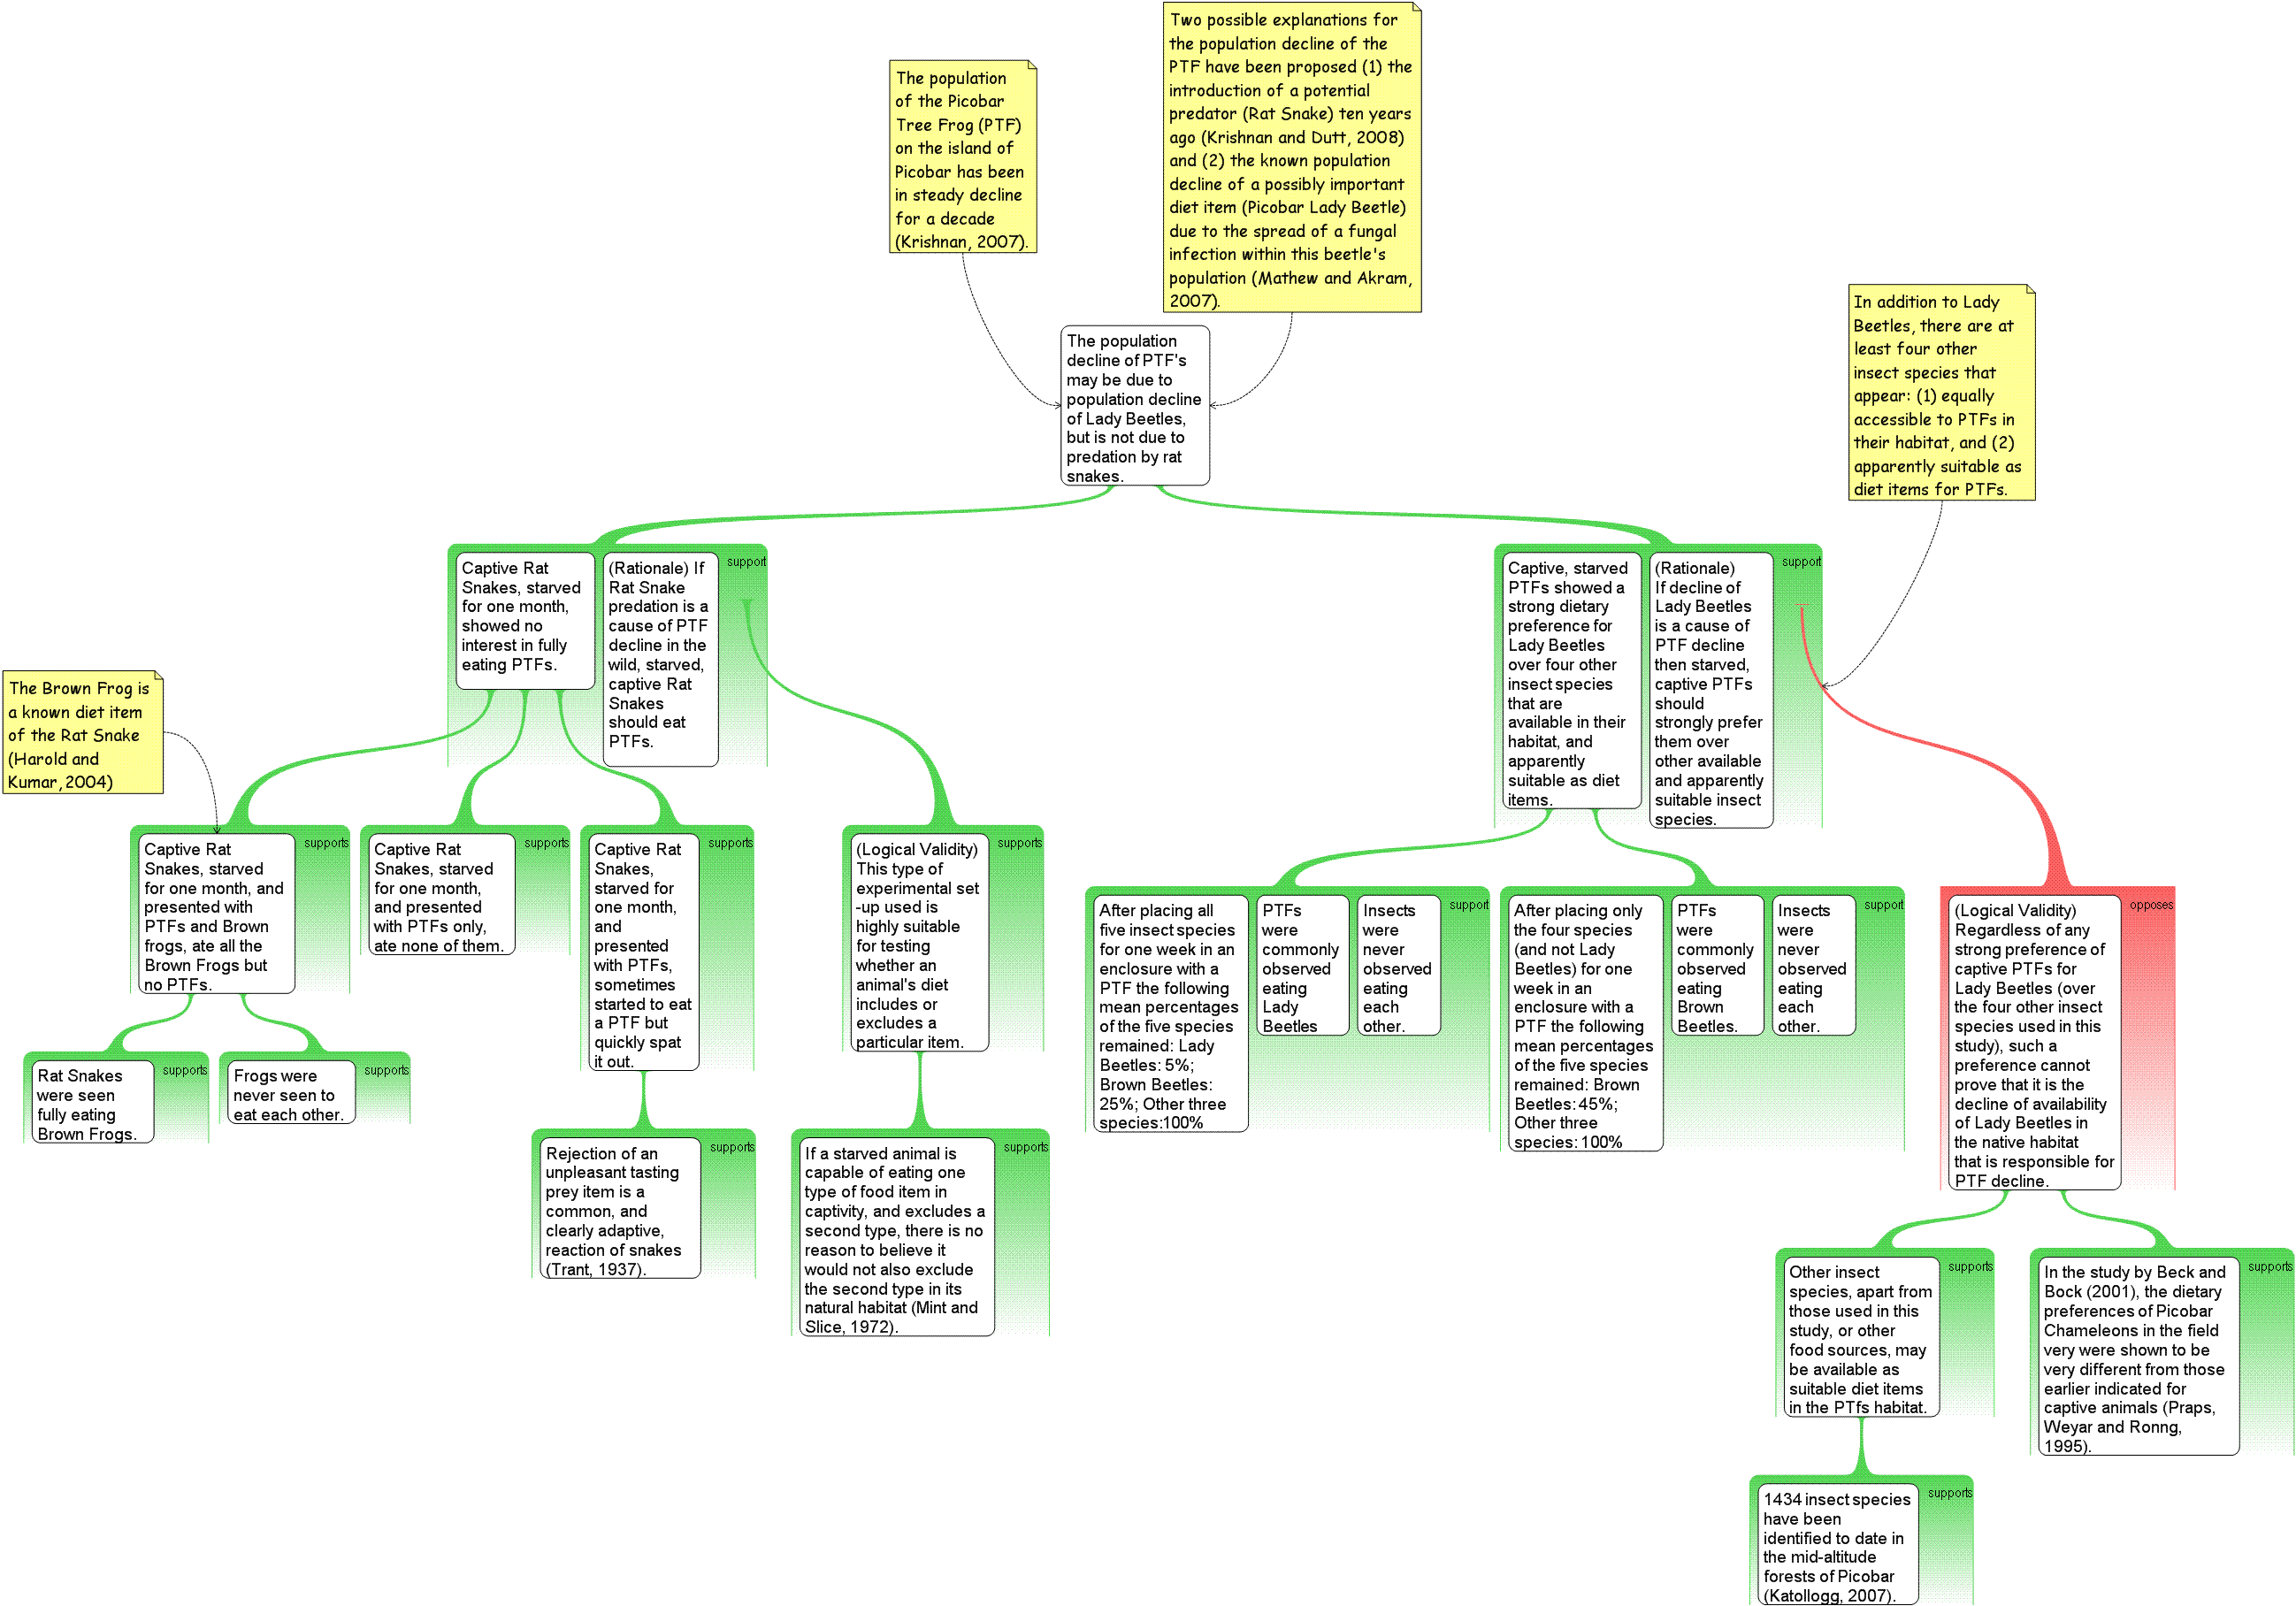
You are provided with an argument map for Part 1 of the Discussion of a paper. Drag the image below (using Rationale's inline browser) onto the Rationale workspace. Further coverage of this topic is provided in this powerpoint presentation (best viewed by turning off the animation: see Slide Show menu, "Set-up Show" option). This map was composed using the Analysis Mode of Rationale. Like the Reasoning Mode map on the previous page, Analysis Maps can use a double annotation system (depth of colour, number of dots) for assessments of argumentative strength. The main difference between the Analysis and the simpler Reasoning mode of mapping, is that co-reasons (generally taking the form of an assumption or rationale ) can be grouped together in a single box with the primary reason (which, in a group of reasons on a map, is the left-hand most reason).
Your tasks are to:
(1) Annotate boxes and branches of the map for argumentative strength and then use stars to indicate your assessment of the relative "scientific impact " of two main branches (this system is described on the previous page)
(2) Use MS Word to write up a two-part Discussion with a initial Framing Paragraph that provides a guide to BOTH parts.
(a) Part 1 will provide a text-version of the argument above. The sequence of the lines of evidence presented should at least in part be influenced by the argumentative strength and scientific impact of the branches. Do not just cut and paste sentences from the map in writing up your text, this will result in a poorly written text.
(b) Part 2 (much briefer) will discuss the wider implications of the study. In this particular case, what might the conclusions of Part 1 tells us about how to manage the population decline of the Picobar Tree Frog? Refer to the powerpoint presentation for possible ideas, or use your own imagination.
......
